// Horizon3.ai · 2022
Turning a powerful AI pentesting engine into a product security teams could actually use.
// The Challenge
Powerful
engine.
Illegible
UI.
The findings were thorough. They were also unreadable. Long lists with no priority, no context, and no next step.
My job was to learn the security space well enough to design for red teamers and CISOs, then turn raw output into decisions either of them could act on.
// What I led
-
01
// Audit
Full application audit with the engineering architects and customer interviews.
-
02
// Shared UX Pattern
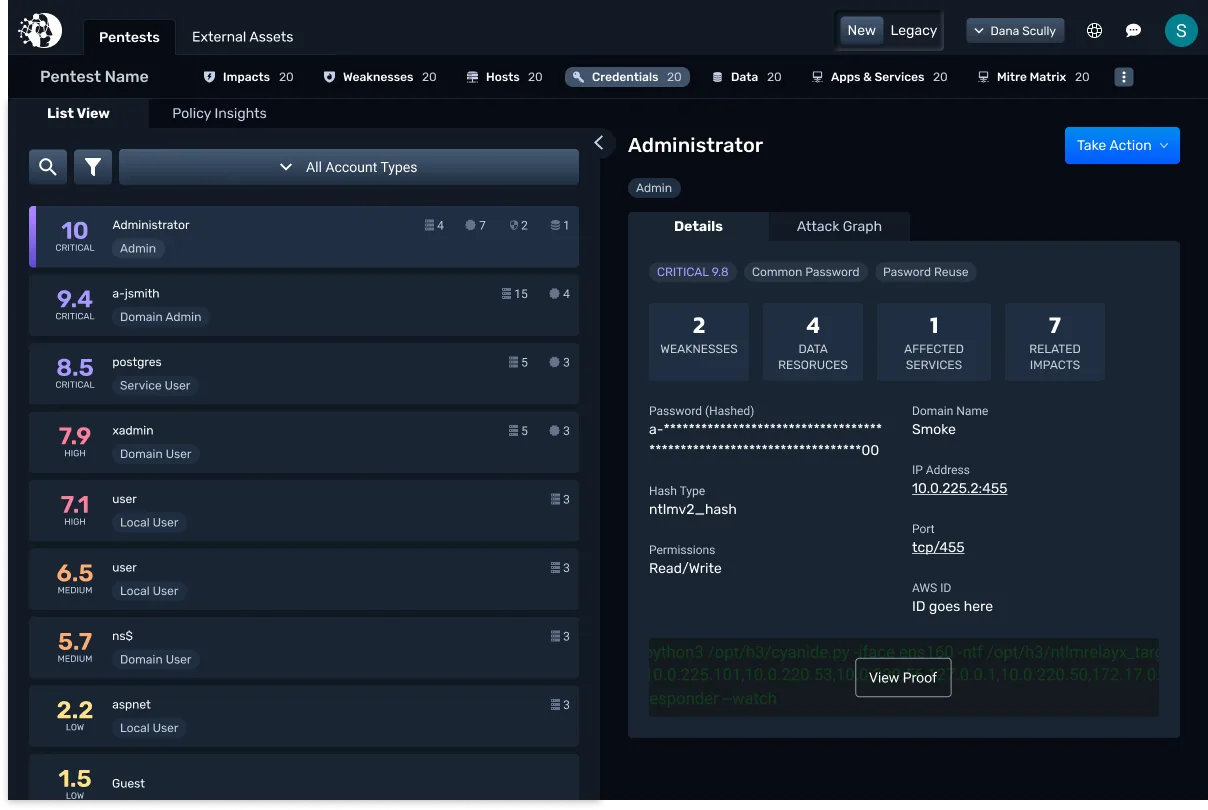
A reusable layout every later feature inherited: list on the left, detail on the right, action in the top corner.
-
03
// New Surfaces
Real-time attack view, executive dashboard, data viz, MITRE ATT&CK matrix, policy insights.
-
04
// Brand Refresh
Visual identity refresh in lockstep with marketing.
01
// Credentials
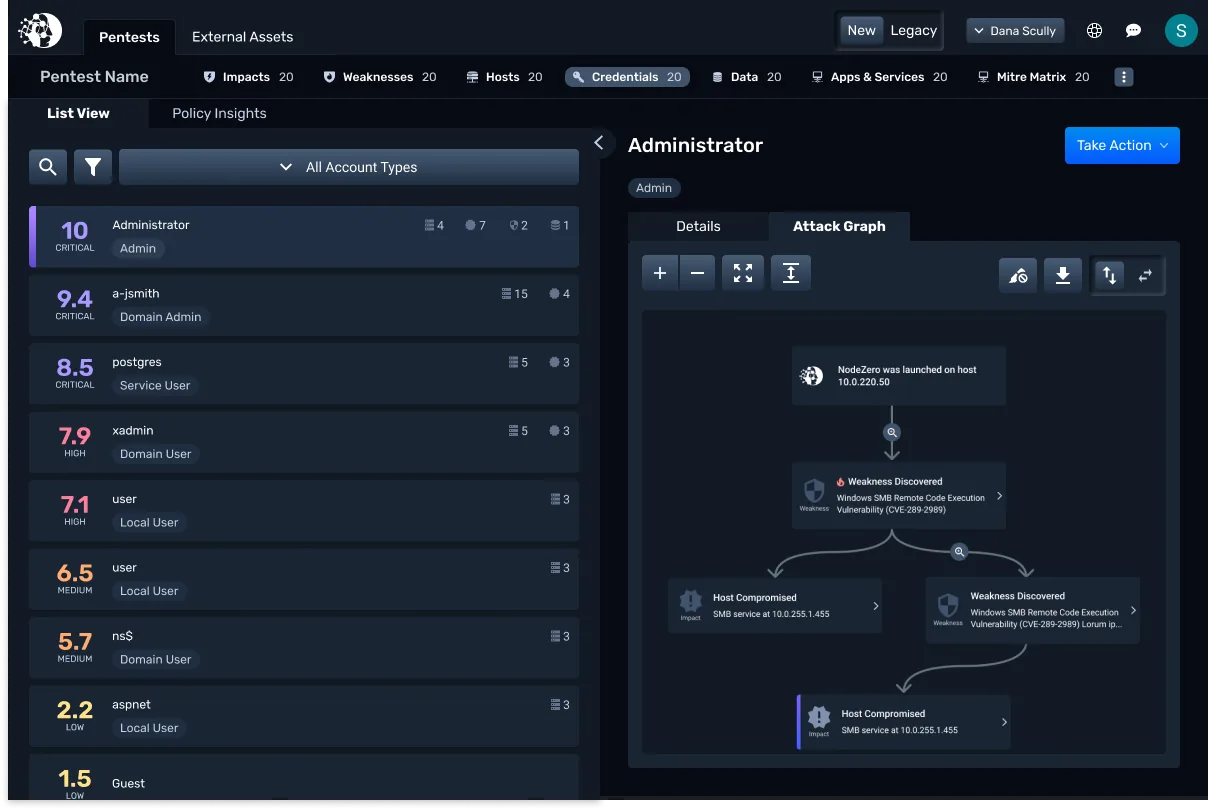
Cracking the password was the easy part. Making it mean something was the design problem.
// The Gap
The old product was built entirely on datatables. Cracked credentials lived as rows in a grid, readable only as raw data. No priority, no context, no path to action.
// The Bet
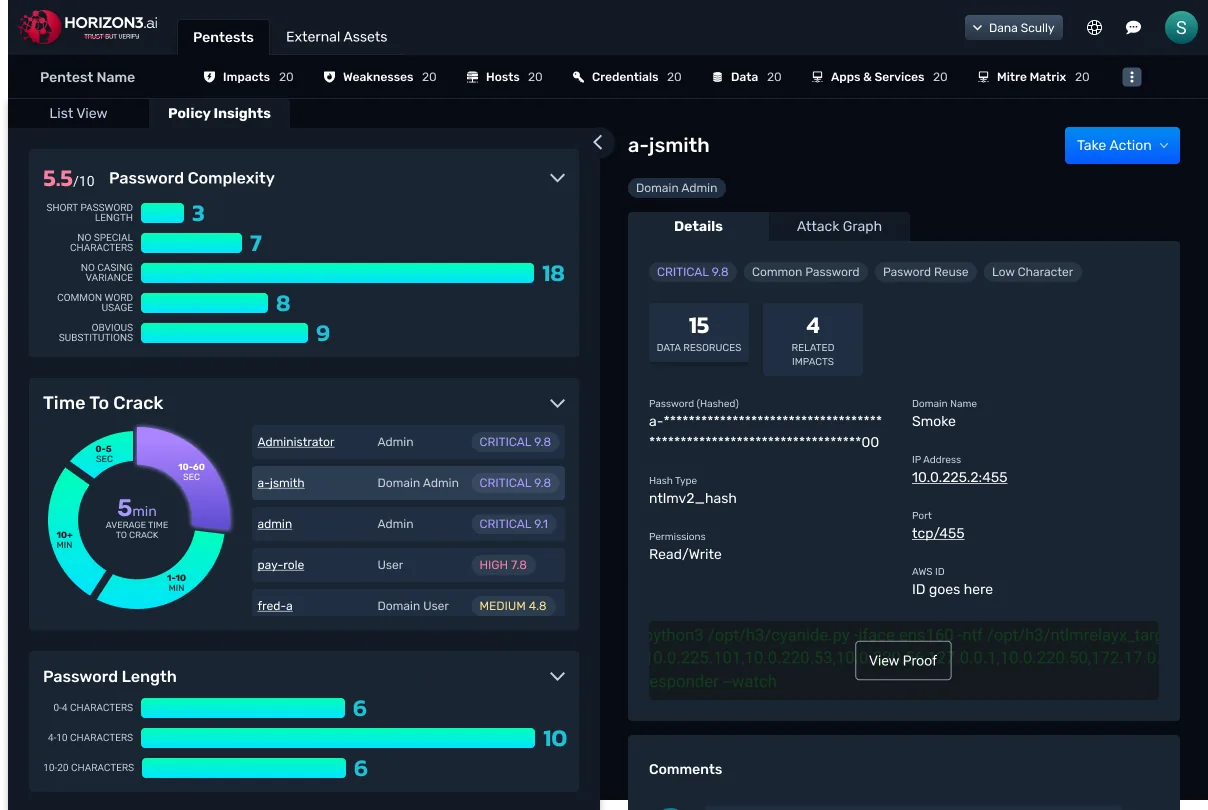
Frame each credential as a thread in a larger risk story, not a row in a table.
-
01
Which credential is the biggest problem right now?
-
02
How did the attacker actually use it?
-
03
What systemic weakness does it expose?
02
// Real-Time Attack View
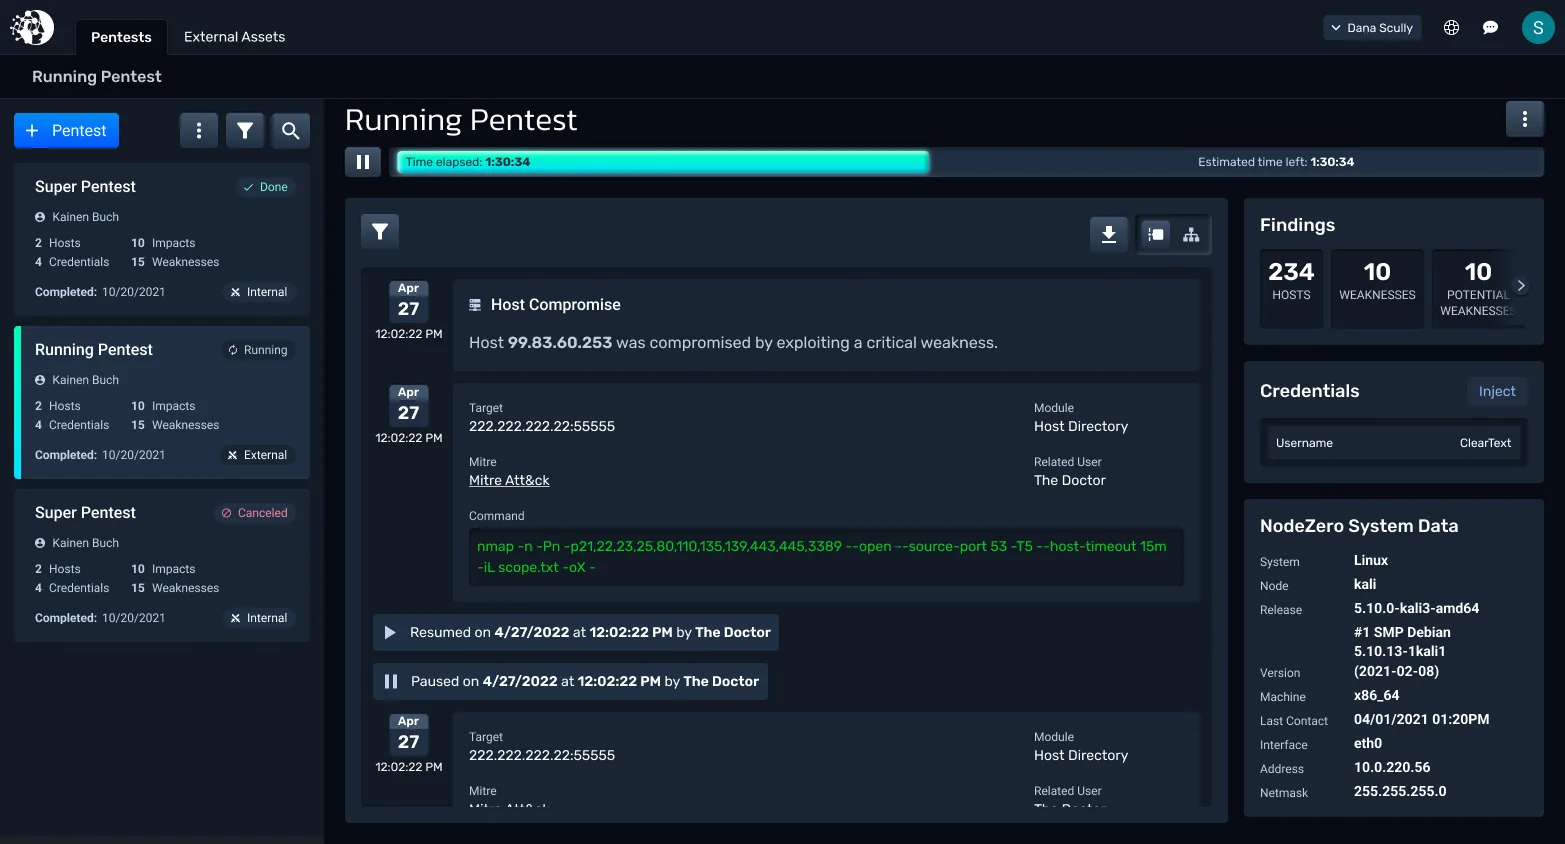
A pentest used to be a black box. We made it a live broadcast.
// The Gap
Customers waited days for the final PDF. They saw the verdict, never the work.
// The Bet
Show the attack as it happens. Every host, every command, every finding, in order.
// Live_telemetry
- // Time Elapsed
- Live timer, pause and resume.
- // Findings
- Hosts touched, weaknesses confirmed and potential.
- // Credentials
- Captured as they crack, ready to inject on the next hop.
- // NodeZero Data
- Which probe is running and against what.
// Why It Mattered
SOC teams could watch their own systems get popped in real time. The pentest doubled as training.
03
// Executive Dashboard
A board-ready story, one screen deep.
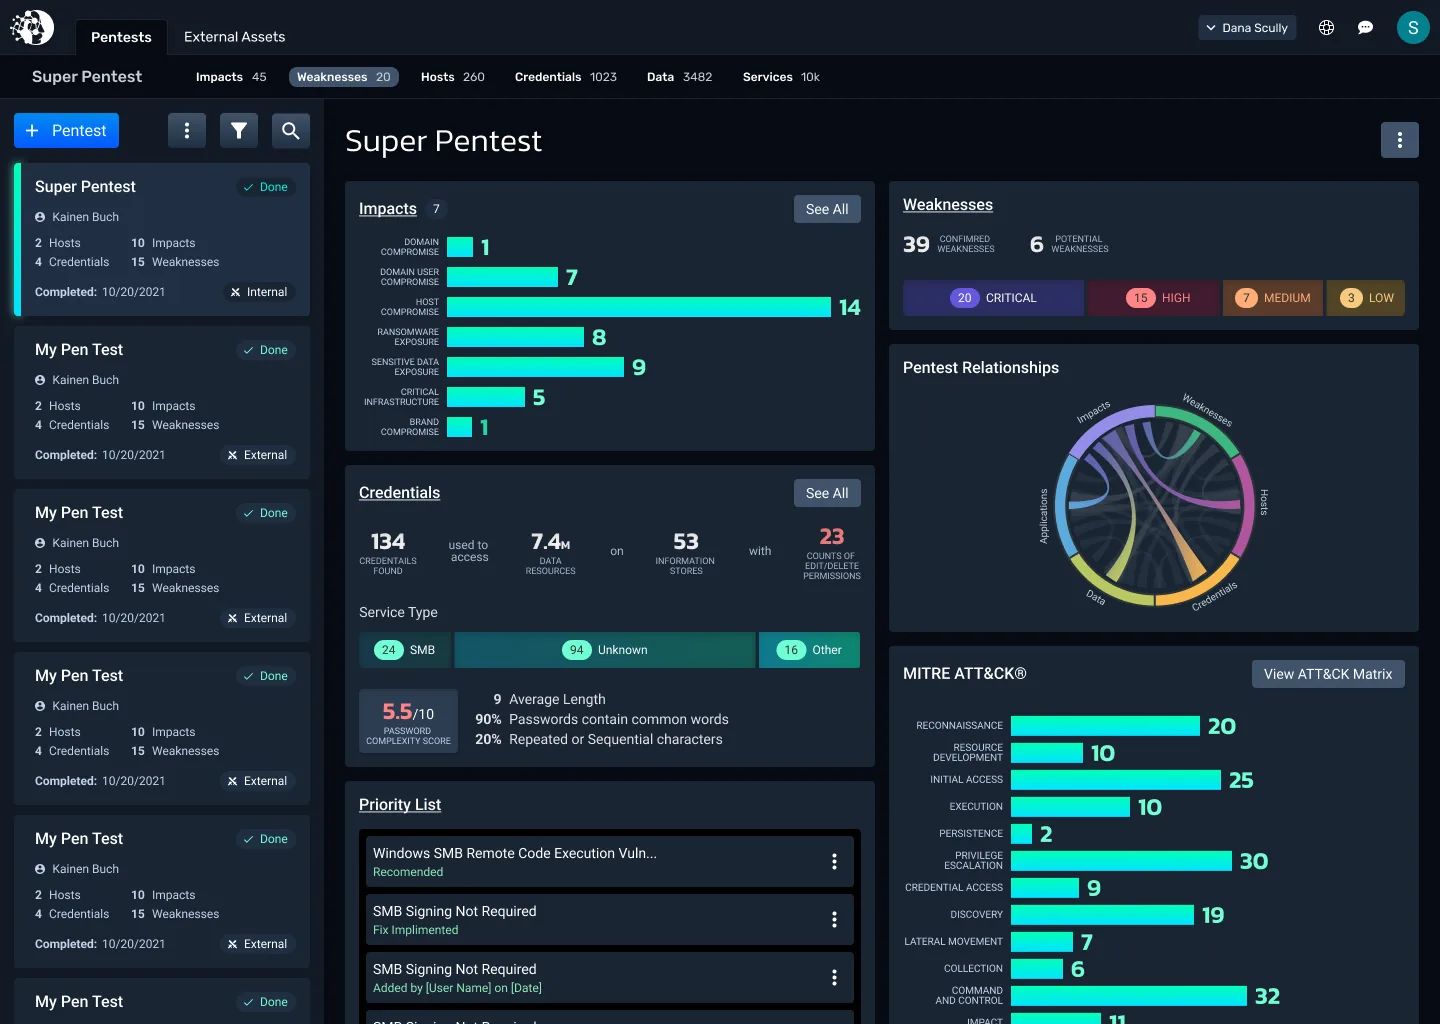
// The Gap
A CISO opening the old product saw raw counts. They needed a posture.
// The Bet
Roll every pentest into a single screen that explains organizational risk.
// Impacts
Domain, host, ransomware, sensitive data, critical infrastructure.
// Weaknesses
Confirmed and potential, grouped by severity.
// Credentials
How many found, how many cracked, what they had edit and delete on.
// MITRE ATT&CK
Coverage across the kill chain. Where the attack landed, where defenses held.
// Priority List
What to fix first, with a one-line reason and the related finding.
// Pentest Relationships
A chord diagram showing how findings recur across tests over time.
// Why It Worked
A blue-team member could pull actionable next steps in seconds. A CISO could lift the same screen straight into a board report. An analyst could drill into any tile and keep going.
// Outcomes
// Valuation
Higher valuation at the next funding round.
// Pipeline
Sales saw measurable increases with the new real-time attack view leading deals.
// Org-Wide
The whole company pivoted. Marketing and product direction both realigned to the new patterns.